More than 13,000 self-described “data and visualization nerds” gathered in Austin, TX, recently for Tableau Software’s annual customer conference. In his inaugural keynote, Tableau’s new CEO, Adam Selipsky, said that nearly 9,000 were first-time attendees. I was impressed with the enthusiasm of the customers who had gathered for the event, cheering as company officials reviewed product plans and demonstrated new features. This enthusiasm suggests Tableau has provided capabilities that resonate with its users. Among other things, the company used the conference to outline a number of planned product enhancements.
Tableau Prepares for Future with Data Preparation and Collaboration
Topics: Tableau, Analytics, Business Intelligence, Visualization, DataPrep
IBM Redesigns Cognos to Improve User Experience and Self-Service
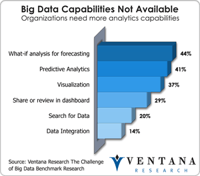
IBM redesigned its business intelligence platform, now called IBM Cognos Analytics. Expected to be released by the end of 2015, the new version includes features to help end users model their own data without IT assistance while maintaining the centralized governance and security that the platform already has. Our benchmark research into information optimization shows that simplifying access to information is important to virtually all (97%) participating organizations, but it also finds that only one in four (25%) are satisfied with their current software for doing that. Simplification is a major theme of the IBM Cognos redesign.
Topics: Big Data, Mobile Technology, Wearable Computing, Operational Performance, Analytics, Business Analytics, Business Intelligence, Business Performance, Governance, Risk & Compliance (GRC), Information Management, Operational Intelligence, Uncategorized, Visualization, Cognos, Information Optimization, Risk & Compliance (GRC), Watson, cognos analytics
Tableau Continues Evolution of Analytics Platform
Tableau Software’s annual conference, which company spokespeople reported had more than 10,000 attendees, filled the MGM Grand in Las Vegas. Various product announcements supported the company’s strategy to deliver value to analysts and users of visualization tools. Advances include new data preparation and integration features, advanced analytics and mapping. The company also announced the release of a stand-alone mobile application called Vizable . One key message management aimed to promote is that Tableau is more than just a visualization company.
Topics: Big Data, Tableau, Mobile Technology, data viz, Operational Performance, Analytics, Business Analytics, Business Intelligence, Business Performance, Governance, Risk & Compliance (GRC), Information Management, Operational Intelligence, Visualization, Information Optimization, Risk & Compliance (GRC)
IBM’s Vision user conference brings together customers who use its software for financial and sales performance management (FPM and SPM, respectively) as well as governance, risk management and compliance (GRC). Analytics is a technology that can enhance each of these activities. The recent conference and many of its sessions highlighted IBM’s growing emphasis on making more sophisticated analytics easier to use by – and therefore more useful to – general business users and their organizations. The shift is important because the IT industry has spent a quarter of a century trying to make enterprise reporting (that is, descriptive analytics) suitable for an average individual to use with limited training. Today the market for reporting, dashboards and performance management software is saturated and largely a commodity, so the software industry – and IBM in particular – is turning its attention to the next frontier: predictive and prescriptive analytics. Prescriptive analytics holds particular promise for IBM’s analytics portfolio.
Topics: Big Data, Planning, Predictive Analytics, Governance, Human Capital, Budgeting, Customer Performance, Operational Performance, Analytics, Business Analytics, Business Performance, Cloud Computing, Financial Performance, Visualization
Tableau Continues its Visual Analytics Revolution
In his keynote speech at the sixth annual Tableau Customer Conference, company co-founder and CEO Christian Chabot borrowed from Steve Jobs’ famous quote that the computer “is the equivalent of a bicycle for our minds,” to suggest that his company software is such a new bicycle. He went on to build an argument about the nature of invention and Tableau’s place in it. The people who make great discoveries, Chabot said, start with both intuition and logic. This approach allows them to look at ideas and information from different perspectives and to see things that others don’t see. In a similar vein, he went on, Tableau allows us to look at things differently, understand patterns and generate new ideas that might not arise using traditional tools. Chabot key point was profound: New technologies such as Tableau with its visual analytics software can use new and big data sources of information are enablers and accelerators of human understanding.
Topics: Sales Performance, IT Performance, Operational Performance, Analytics, Business Analytics, Business Intelligence, Business Performance, CIO, Cloud Computing, Customer & Contact Center, Information Applications, Information Management, Location Intelligence, Visualization, Data
It has become evident from the advancements we’ve seen in the business analytics market that the use of visualization is now becoming mainstream. In my analysis of the market last year I wrote about the pathetic state of dashboards, where the assumption in the business intelligence software industry is that placing four to six charts or tables of data in a screen and publishing to business users can create business intelligence. That assumption has yet to be proven and is completely irrational, as presenting analytics in basic charts does little to provide context and a guide for taking actions and making decisions.
Topics: IT Performance, Analytics, Business Analytics, Business Intelligence, Information Applications, Information Management, Location Intelligence, Operational Intelligence, Visualization
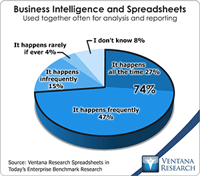
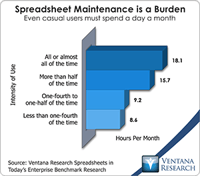
The spreadsheet is one of the five most important advances in business management over the last 50 years. It has changed all aspects of running an organization. It was the original “killer app” that made people go out and buy personal computers. So you see I’m enthusiastic about spreadsheets, but I realize they have limits that must be respected to work efficiently. One of the more important findings from our benchmark research Spreadsheets for Today’s Enterprise was about the time spent in maintaining spreadsheets. We asked participants how much time they spend per month in updating, revising, consolidating, modifying and correcting the spreadsheet used in the most important process associated with their job. The answers varied depending on the intensity with which people work with spreadsheets. On average, the heaviest users – those whose work requires them to spend all or almost all of their time using them – spend 18.1 hours per month on maintenance – the equivalent of more than two days per month! Even those who spend more than half their time in this fashion use up nearly two days (15.7 hours). For a tool designed to enhance personal productivity, these results should be sobering to executives and managers.
Topics: Sales Performance, Supply Chain Performance, Office of Finance, Reporting, enterprise spreadsheet, Operational Performance, Analytics, Business Analytics, Business Intelligence, Business Performance, Customer & Contact Center, Financial Performance, Information Applications, Information Management, Visualization, Workforce Performance, Risk, benchmark, Financial Performance Management
Four Types of Discovery Technology For Using Big Data Intelligently
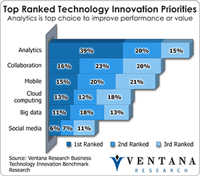
Information technology for business is changing rapidly as organizations demand innovation to help them discover insights and facts. Our research into business technology innovation found analytics to be the top priority in 39 percent of organizations. Businesses feel pressure to be better, faster and smarter in operating processes, and understanding their various types of information is a key to success. Businesses are looking to capture value from all types of information both within the enterprise and on the Internet. In this context technology providers are now using the term “discovery” to capture potential buyers’ attention; it became an area for technology spending in 2012 and likely will be for years to come. In fact my colleague Tony Cosentino has identified discovery as one of the four pillars of big data analytics.
Topics: Big Data, Sales Performance, Supply Chain Performance, Event discovery, Operational Performance, Analytics, Business Analytics, Business Intelligence, Business Performance, CIO, Customer & Contact Center, Financial Performance, Information Applications, Information Management, Location Intelligence, Operational Intelligence, Visualization, Workforce Performance, Data, Data Discovery, Information Discovery
Investigate User-Friendly Spreadsheet Alternatives
I’ve been using spreadsheets for more than 30 years. I consider this technology tool among the five most important advances in business management of the 20th century. Spreadsheets have revolutionized many aspects of running an organization. Yet as enthusiastic as I am about them, I know the limits of desktop spreadsheets and the price we pay if we fail to respect those limits. The essential problem arises when people use desktop spreadsheets for purposes beyond what they were originally designed to do. Desktop spreadsheets were designed to be a personal productivity tool, and they are good for prototyping models and creating analytics used in processes, performing one-off analyses using simple models and storing small amounts of data. They were not designed built to be used to manage or support repetitive, collaborative enterprise-wide processes. As a rule of thumb, when a spreadsheet is used by more than six people six or more times, it’s time to look for an alternative. Otherwise, errors and inconsistencies easily creep in and undermine the accuracy and value of important data.
Topics: Sales Performance, Supply Chain Performance, Office of Finance, Reporting, enterprise spreadsheet, Operational Performance, Analytics, Business Analytics, Business Intelligence, Business Performance, Customer & Contact Center, Financial Performance, Governance, Risk & Compliance (GRC), Information Applications, Information Management, Visualization, Workforce Performance, Risk, benchmark, Financial Performance Management
Our recent benchmark research project, Spreadsheet Use in Today’s Enterprise, demonstrated that some companies have made modest progress in addressing spreadsheet issues, but there’s still much left to be done. Desktop spreadsheets can be an important source of productivity but, as I’ve noted, you need to understand their limitations and understand the practical alternatives. Users underestimate the impact of spreadsheet problems on their productivity because they tend to overlook the myriad little issues that constantly crop up. Being human, they overlook the ill effects that occur when spreadsheets are misused, and may be spurred to look for alternatives only when disaster strikes (as it did for one major bank).
Topics: Sales Performance, Supply Chain Performance, Office of Finance, Reporting, enterprise spreadsheet, Operational Performance, Analytics, Business Performance, Customer & Contact Center, Financial Performance, Visualization, Workforce Performance, Risk, benchmark, Financial Performance Management
I’ve been using electronic spreadsheets for more than 30 years. I consider this technology among the 20th century’s top five most important advances in business management. Spreadsheets have revolutionized every aspect of running any organization. A spreadsheet (specifically, VisiCalc) was the original “killer app” that made business people feel the necessity to buy a personal computer.
Topics: Sales Performance, Supply Chain Performance, Office of Finance, Reporting, enterprise spreadsheet, Operational Performance, Analytics, Business Analytics, Business Intelligence, Business Performance, Customer & Contact Center, Financial Performance, Information Applications, Information Management, Visualization, Workforce Performance, Risk, benchmark, Financial Performance Management
The electronic spreadsheet is among the top five most important advances in business management to come along in the last hundred years. It revolutionized almost all aspects of running an organization. It was the original “killer app” that made it necessary for people to go out and buy a personal computer. Yet our recent benchmark research project Spreadsheet Use in Today’s Enterprise confirmed advice we have been giving for the past decade: Spreadsheets are a fabulous tool but they have limits, and those who fail to respect those limits wind up paying a price. The consequences may be obvious, as JP Morgan found when faulty spreadsheets used by its trading desk cost it dearly. Or it may be more subtle, as with all the time people waste trying to make spreadsheets do things they were never designed to do.
Topics: Office of Finance, Reporting, enterprise spreadsheet, Analytics, Business Analytics, Business Performance, Financial Performance, Visualization, Risk, benchmark, Financial Performance Management
Datameer Provides Business Visualization and Discovery for Hadoop
As volumes of data grow in organizations, so do the number of deployments of Hadoop, and as Hadoop becomes widespread, more organizations demand data analysis, ease of use and visualization of large data sets. In our benchmark research on Hadoop, 88 percent of organizations said analyzing Hadoop data is important, and in our research on business analytics 89 percent said it is important to make it simpler to provide analytics and metrics to all users who need them. As my colleague Mark Smith has noted, Datameer has an ambitious plan to tackle these issues. It aims to provide a single solution in lieu of the common three-step process involving data integration, data warehouse and BI, giving analysts the ability to apply analytics and visualization to find the dynamic “why” behind data rather than just the static “what.”
Topics: Big Data, Datameer, MapR, Operational Performance, Business Analytics, Business Intelligence, Business Performance, Cloudera, Customer & Contact Center, Hortonworks, IBM, Information Applications, Operational Intelligence, Visualization, Data Discovery, Strata+Hadoop
Steve Jobs Leaves an Indelible Mark on Business Intelligence
About 30 years ago, perhaps on this very day, I was sitting in front of an Apple II working on a VisiCalc spreadsheet. At the time, I don’t think I even knew who Steve Jobs was. I wasn’t in the software industry yet. I was working for a public accounting firm. The Apple II sat in a corner of the office “typing pool.” For those of you who don’t know what a typing pool was, there was no swimming involved – it was a group of full-time employees with dedicated equipment who did all the typing and word processing tasks of the office.
Topics: Mobile, Sales Performance, Supply Chain Performance, Operational Performance, Business Analytics, Business Intelligence, Business Performance, Customer & Contact Center, Financial Performance, Visualization, Workforce Performance
Oracle Unveils the BI Appliance Called Exalytics
Oracle kicked off its Open World 2011 conference with the announcement ofExalytics, a new data warehouse appliance specifically for business intelligence (BI). Three years ago when Oracle introduced the Exadata product line it was based on hardware from Hewlett-Packard. Since then it has acquired Sun Microsystems and replaced the HP components in Exadata, assuming complete control over the hardware and software included in the appliance. Oracle also introduced two other appliance products: Exalogic, which is focused on Oracle Applications, and more recently the Oracle Database Machine. Oracle’s new tag line, “Hardware and software, engineered to work together,” indicates its emphasis on these appliances and the potential for more, perhaps even some to be announced at Open World.
Topics: Sales Performance, Supply Chain Performance, Operational Performance, Business Analytics, Business Intelligence, Business Performance, Customer & Contact Center, Exalytics, Financial Performance, Oracle, Visualization, Workforce Performance, Digital Technology
MicroStrategy Takes Cloud Computing Personally
This has been the year of the cloud for MicroStrategy. After ignoring early competition from cloud-based business intelligence (BI) providers, the company has jumped on the cloud BI bandwagon. At MicroStrategy Worldearly this year it announced a program called Cloud Intelligence and this summer introduced MicroStrategy Cloud, a complete BI platform with the option of using either IBM Netezza or ParAccel as the database and Informatica as the data integration environment. Now the company has expanded its cloud offerings to include MicroStrategy Cloud Personal, which enables individuals to easily upload spreadsheet data, analyze it and share it with others. (A free version is currently in beta testing.)
Topics: MicroStrategy, SaaS, Sales Performance, Software as a Service, Supply Chain Performance, Operational Performance, Business Analytics, Business Intelligence, Business Performance, Cloud Computing, Customer & Contact Center, Financial Performance, Visualization, Workforce Performance
Pentaho 4 Unites Enterprise Business Intelligence and Data Integration
As recently as two years ago, Pentaho was all about open source business intelligence. The company used an open source business model to build a base of more than 1,200 paying customers and establish more than 8,000 production deployments. It still has an open source business model, but the company has created a broad yet integrated product line that deserves to be evaluated on its features, not just its licensing scheme. This week Pentaho announced version 4.0 of its BI suite along with version 4.2 of Pentaho Data Integration (aka Kettle).
Topics: Pentaho, Sales Performance, Social Media, Supply Chain Performance, Operational Performance, Business Analytics, Business Intelligence, Business Performance, Customer & Contact Center, Financial Performance, OLAP, Visualization, Workforce Performance