Tableau Software’s annual conference, which company spokespeople reported had more than 10,000 attendees, filled the MGM Grand in Las Vegas. Various product announcements supported the company’s strategy to deliver value to analysts and users of visualization tools. Advances include new data preparation and integration features, advanced analytics and mapping. The company also announced the release of a stand-alone mobile application called Vizable . One key message management aimed to promote is that Tableau is more than just a visualization company.
Over the last few years Tableau has made strides in the analytics and business intelligence market with a user-centric philosophy and the ability to engage younger analysts who work in the lines of business rather than in IT. Usability continues to rank as the top criteria for selecting analytic and business intelligence software in all of our business analytics benchmark research. In this area Tableau has introduced innovations such as VizQL, originally developed at Stanford University, which links capabilities to query a database and to visualize data. This combination enables users not highly skilled in languages such as SQL or using proprietary business intelligence tools to create and share visually intuitive dashboards. The effect is to provide previously unavailable visibility into areas of their operations. The impact of being able to see and compare performance across operations and people often increases communication and knowledge sharing.
Tableau 9, released in April 2015, which I discussed, introduced advances including analytic ease of use and performance, new APIs, data preparation, storyboarding and Project Elastic, the precursor to this year’s announcement of Vizable. Adoption of 9.x appears to be robust given both the number of conference attendees and increases in third-quarter revenue ($170 million) and new customers (3,100) reported to the financial markets.
As was the case last year, conference announcements included some developments already on the market as well as some still to come. Among data preparation capabilities introduced are integration and automated spreadsheet cleanup. For the former, being able to join two data sets through a union function, which adds rows to form a single data set, and to do integration across databases by joining specific data fields gives users flexibility in combining, analyzing and visualizing multiple sets of data. For the latter, to automate the spreadsheet cleanup process Tableau examined usage patterns of Tableau Public to learn how users manually clean their spreadsheets. Then it used machine-learning algorithms to help users automate the tasks. Being able to automatically scan Excel files to find subtables and automatically transform data without manual calculations and parsing will save time for analysts who 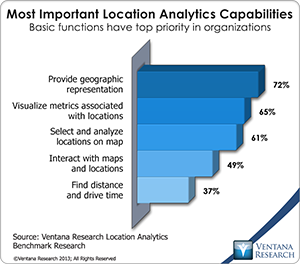 otherwise would have to do these tasks manually. Our benchmark research into information optimization shows that data preparation consumes the largest portion of time spent on analytics by nearly half (47%) of organizations and even higher in our latest data and analytics in the cloud benchmark research by 59 percent of organizations.
Advanced analytics is another area of innovation for Tableau. The company demonstrated developments in outlier detection and clustering analysis natively integrated with the software. Use of these features is straightforward and visually oriented, replacing the need for statistical charts with drag-and-drop manipulation. The software does not enable users to identify numbers of segments or filter the degree of the outliers, but the basic capability can reduce data sets to more manageable analytic sets and facilitate exploration of anomalous data points within large sets. The skill necessary for these tasks, unlike the interpretation of box plots introduced at last year’s conference, is more intuitive and better suited for business users of information.
The company also demonstrated new mapping and geospatial features at the conference. Capabilities to analyze down to the zip code on a global basis, define custom territories, support geospatial files, integrate with  the open source mapping platform MapBox and perform calculations within the context of a digital map are all useful features for location analytics, which is becoming more important in areas such as customer analytics and digital devices connected in the emerging Internet of things (IoT). Tableau is adding capabilities that participants most often cited as important in our research on location analytics: to provide geographic representation (72%), visualize metrics associated with locations (65%) and directly select and analyze locations on maps (61%).
Tableau insists that its development of new capabilities is guided by customer requests. This provides a source of opportunities to address user needs especially in the areas of data preparation, advanced analytics and location analytics. However, this strategy raises the question of whether it will ultimately put the company in conflict with the partners that have helped build the Tableau ecosystem and feed the momentum of the company thus far. Tableau is positioning its product as a fully featured analytic platform of the sort that I have outlined, but to achieve that eventually it will have to encroach on the capabilities that partners such as Alteryx, Datawatch, Informatica, Lavastorm, Paxata and Trifacta offer today. Another question is whether Tableau will continue its internal development strategy or opt to acquire companies that can broaden its capabilities that has hampered its overall value rating as identified in our 2015 Analytics and Business intelligence Value Index. In light of announcements at the conference, the path seems to be to develop these capabilities in-house. While there appears to be no immediate threat to the partnerships the continuation of development of some of these capabilities eventually will impact the partner business model in a more material way. Given that the majority of the deals for its partner ecosystem flows through Tableau itself, many of the partners are vulnerable to these development efforts. In addition I will be watching how aggressively Tableau helps to market Spark, the open source big data technology that I wrote about, as compared to some of the partner technologies that Spark threatens. Tableau has already built on Spark while some of its competitors have not, which may give Tableau a window of opportunity.
Going forward, integration with transactional systems and emerging cloud ecosystems is an area for Tableau that I will be watching. Given its architecture it’s not easy for Tableau to participate in the new generation of service-oriented architectures that characterize part of today’s cloud marketplace. For this reason, Tableau will need to continue to build out its own platform and the momentum of its ecosystem – which at this point does not appear to be a problem.
Finally, it will be interesting to see how Tableau eventually aligns its stand-alone data visualization application Vizable with its broader mobile strategy. We will be looking closely at the mobile market in our upcoming Mobile Analytics and Business Intelligence Value Index in the first half of 2016 where in our last analysis found Tableau was in the middle of the pack with other providers but they have made more investments since our last analysis.
We recommend that companies exploring analytics platforms, especially for on-premises and hosted cloud use, include Tableau on their short lists. Organizations that consider deploying Tableau on an enterprise basis should look closely at how it aligns with their broader user requirements and if their cloud strategy will meet its future needs. Furthermore, while the company has made improvements in manageability and performance, these can still be a concern in some circumstances. Tableau should be evaluated also with specific business objectives in mind and in conjunction with its partner ecosystem.
Regards,
Tony Cosentino
VP and Research Director
Authors:
Ventana Research
Ventana Research, now part of Information Services Group (ISG), is the most authoritative and respected market research and advisory services firm focused on improving business outcomes through optimal use of people, processes, information and technology. Since our beginning, our goal has been to provide insight and expert guidance on mainstream and disruptive technologies. In short, we want to help you become smarter and find the most relevant technology to accelerate your organization's goals.