IBM’s SPSS Analytic Catalyst enables business users to conduct the kind of advanced analysis that has been reserved for expert users of statistical software. As analytic modeling becomes more important to businesses and models proliferate in organizations, the ability to give domain experts advanced analytic capabilities can condense the analytic process and make the results available sooner for business use. Benefiting from IBM’s research and development in natural-language processing and its statistical modeling expertise, IBM SPSS Analytic Catalyst can automatically choose an appropriate model, execute the model, test it and explain it in plain English.
Information about the skills gap in analytics and the need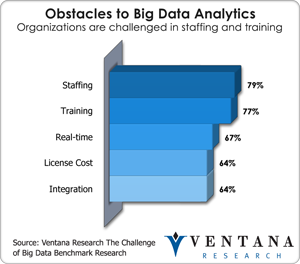 for more user-friendly tools indicates pent-up demand for this type of tool. Our benchmark research into big data shows that big data analytics is held back most by lack of knowledgeable staff (79%) and lack of training (77%).
In the case of SPSS Analytic Catalyst, the focus is on driver analysis. In its simplest form, a driver analysis aims to understand cause and effect among multiple variables. One challenge with driver analysis is to determine the method to use in each situation (choosing among, for example, linear or logistic regression, CART, CHAID or structural equation models). This is a complex decision which most organizations leave to the resident statistician or outsource to a professional analyst. Analytic Catalyst automates the task. It does not consider every method available, but that is not necessary. By examining the underlying data characteristics, it can address data sets, including what may be considered big data, with an appropriate algorithm. The benefit for nontechnical users is that Analytic Catalyst makes the decision on selecting the algorithm.
The tool condenses the analytic process into three steps: data upload, selection of the target variable (also called the dependent variable or outcome variable) and data exploration. Once the data is uploaded, the system selects target variables and automatically correlates and associates the data. Based on characteristics of the data, Analytic Catalyst chooses the appropriate method and returns summary data rather than statistical data. On the initial screen, it communicates so-called “top insights” in plain text and presents visuals, such as a decision tree in a churn analysis. Once the user has absorbed the top-level information, he or she can drill down into top key drivers. This enables users to see interactivity between attributes. Understanding this interactivity is an important part of driver analysis since causal variables often move together (a challenge known as multicollinearity) and it is sometimes hard to distinguish what is actually causing a particular outcome. For instance, analysis may blame the customer service department for a product defect and point to it as the primary driver of customer defection. Accepting this result, a company may mistakenly try to fix customer service when it is a product issue that needs to be addressed. This approach also overcomes the challenge of Simpson’s paradox, which is a hindrance for some visualization tools in the market. On subsequent navigations, Analytic Catalyst goes even further into how different independent variables move together, even if they do not directly explain the outcome variable.
Beyond the ability to automate modeling and enable exploration of data, I like that this new tool is suitable for both statistically inclined users (who can use it to get r-scores, model parameters or other data) and business users (whom visualizations and natural language walk through what things mean). Thus it enables cross-functional conversations and allows the domain expert to own the overall analysis.
I also like the second column of the “top key driver” screen, through which users can drill down into different questions regarding the data. Having a complete question set, the analyst can simply back out of one question and dive into another. The iterative process aligns naturally with the concept of data exploration.
IBM seems to be positioning the tool to help with early-stage analysis. From the examples I’ve seen, however, I think Analytic Catalyst would work well also as a back-end tool for marketers trying to increase wallet share through specific campaigns or for efforts by operations personnel to reduce churn by creating predefined actions at the point of service for particular at-risk customer populations.
IBM will need to continue to work with Analytic Catalyst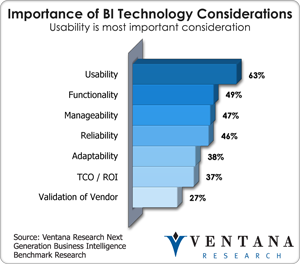 to get it integrated with other tools and ensure that it keeps the user experience in mind. Usability is the key buying criteria for nearly two-thirds (64%) of companies, according to our benchmark research into next-generation business intelligence.
It is important that the data models align with other models in the organization, such as customer value models, so that the right populations are targeted. Otherwise a marketer or operations person would likely need to figure this out in a different system, such as a BI tool. Also that user would have to put the analytical output into another system, such as a campaign management or business process tool, to make it actionable. Toward this end, I expect that IBM is working to integrate this product within its own portfolio and those of its partners.
SPSS Analytic Catalyst has leaped over the competition in putting sophisticated driver analytics into natural language that can guide almost any user through complex analytic scenarios. However, competitors are not standing still. Some are working on similar tools that apply natural language to sophisticated commodity modeling approaches, and many of the visual discovery vendors have similar but less optimized approaches. With the less sophisticated approaches, the question comes down to optimizing vs. satisfying. Other tools in the market satisfy the basic need for driver analysis (usually approached through simple correlation or one type of decision tree), but a more dynamic approach to driver analysis such as offered by IBM can reveal deeper understanding of the data. The answer will depend on an organization and its user group, but in fast-moving markets and scenarios where analytics is a key differentiator, this is a critical question to consider.
Regards,
Tony Cosentino
VP and Research Director
Authors:
Ventana Research
Ventana Research, now part of Information Services Group (ISG), is the most authoritative and respected market research and advisory services firm focused on improving business outcomes through optimal use of people, processes, information and technology. Since our beginning, our goal has been to provide insight and expert guidance on mainstream and disruptive technologies. In short, we want to help you become smarter and find the most relevant technology to accelerate your organization's goals.