More than 13,000 self-described “data and visualization nerds” gathered in Austin, TX, recently for Tableau Software’s annual customer conference. In his inaugural keynote, Tableau’s new CEO, Adam Selipsky, said that nearly 9,000 were first-time attendees. I was impressed with the enthusiasm of the customers who had gathered for the event, cheering as company officials reviewed product plans and demonstrated new features. This enthusiasm suggests Tableau has provided capabilities that resonate with its users. Among other things, the company used the conference to outline a number of planned product enhancements.
Not resting on its laurels as a data visualization software provider, Tableau demonstrated a variety of new capabilities for displaying data. Enhanced tool tips were common to several of the new features. For example, visualization within visualization displays a graph on top of another graph as the user hovers over data points. Hover lines, which are vertical lines on charts, show a variety of data values not just the data value in the chart. Interactive tool tips showing values used to filter the displayed data can show items with similar characteristics in the charts or graphs.
Mapping capabilities are enhanced so that layers of different sets of data or different types of location data can be displayed simultaneously. Tableau executives also demonstrated a natural-language query interface that can interpret concepts such as “near” or “expensive” using machine-learning techniques. All in all, these interface enhancements make it easier for users to get more information as they are navigating through data.
Data preparation is a hot topic, as I have written. For its part Tableau is adding self-service data preparation through an effort called Project Maestro. Data preparation will be a stand-alone application that enables users to access and prepare data prior to visualization. With interactive capabilities to join tables, split fields and profile data, users can be more certain that the data is ready for the analyses that they want to perform. Long having focused on business users, Tableau is trying to appeal to IT also by introducing new governance capabilities to Tableau Server. As data sources are published, they can be reviewed and certified. IT personnel can ensure that the proper joins, security rules and performance optimizations are incorporated. Business users can trust the content on which they are relying. The governance features will also include the frequency of usage and impact analysis to identify where data sources are used.
In some other areas Tableau is catching up with the competition, adding features that users value but were missing from its products previously. One example is alerts. Another is collaboration, including threaded discussions in which analyses can be embedded. I’ve written about the value of collaboration for years.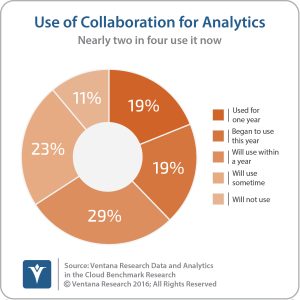 Our data and analytics in the cloud benchmark research shows that more than half (52%) of organizations use or intend to use collaboration with analytics. Users should welcome these new features, but Tableau could make collaboration even more valuable by adding tasks or assignments so that analysis can lead to action, not just discussion. Tableau also continues to round out its cloud capabilities, but like some other vendors its cloud implementation has not achieved parity with the desktop product. As part of its cloud efforts, Tableau also announced a Linux version of its server, which is a common operating system for cloud-based systems.
Tableau will also be introducing a new data engine based its acquisition of Hyper earlier this year. Tableau uses an in-memory data engine to accelerate the speed of interacting with data, but the current engine has posed two limitations that it hopes to address with Hyper. The first is scalability, and the second is near-real-time capabilities. During the conference the company demonstrated a development version of Hyper loading more than 300,000 rows per second. The Hyper architecture allows data loading to happen simultaneously with querying, eliminating down time. Hyper will appear first in Tableau’s cloud offerings as a proving ground and later in the on-premises versions.
The conference allowed Tableau to polish its core strengths of visualization and usability. It promises a set of valuable enhancements as well as some features that will help it keep up with the competition. Most of these new features are scheduled to be released in 2017. Tableau has also advanced its mobile capabilities to address its gaps I identified in the 2016 Ventana Research Mobile Business Intelligence Value Index to more easily consume analytics on smartphones and tablets. Tableau has a loyal following of customers that allows it the luxury of time to deliver these capabilities. You may want to check these out, too, especially the clever visualization techniques being added.
Regards,
David Menninger
SVP & Research Director
Follow Me on Twitter @dmenningerVR and Connect with me on LinkedIn.
Authors:

David Menninger
Executive Director, Technology Research
David Menninger leads technology software research and advisory for Ventana Research, now part of ISG. Building on over three decades of enterprise software leadership experience, he guides the team responsible for a wide range of technology-focused data and analytics topics, including AI for IT and AI-infused software.