Our benchmark research into big data analytics shows that marketing in the form of cross-selling and upselling (38%) and customer understanding (32%) are the top use cases for big data analytics. Related to these uses, organizations today spend billions of dollars on programs seeking customer loyalty and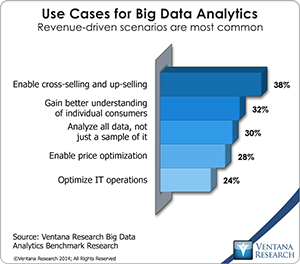 satisfaction. A powerful metric that impacts this spending is net promoter score (NPS), which attempts to connect brand promotion with revenue. NPS has proven to be a popular metric among major brands and Fortune 500 companies. Today, however, the advent of big data systems brings the value and the accuracy of NPS into question. It and similar loyalty metrics face displacement by big data analytics capabilities that can replace stated behavior and survey-based attitudinal data with actual behavioral data (sometimes called revealed behavior) combined with unstructured data sources such as social media. Revealed behavior shows what people have actually done and thus is a better predictor of what they will do in the future than what they say they have done or intend to do in the future. With interaction through various customer touch points (the omnichannel approach) it is possible to measure both attitudes and revealed behavior in a digital format and to analyze such data in an integrated fashion. Using innovative technology such as big data analytics can overcome three inherent drawbacks of NPS and similar customer loyalty and satisfaction metrics.
Such metrics have been part of the vernacular in boardrooms, organizational cultures and MBA programs since the 1980s, based on frameworks such as the Balanced Scorecard introduced by Kaplan and Norton. Net promoter score, a metric to inform the customer quadrant of such scorecards, is based on surveys in which participants are asked how likely they are to promote a brand based on an 11-point scale. The percentage of detractors (scores 0-6) is subtracted from the percentage of promoters (9-10) to produce the net promoter score. This score helps companies assess satisfaction around a brand and allows executives and managers to allocate resources. The underlying assumption is that attitude toward a brand is a leading indicator of intent and behavior. As such, NPS ostensibly can predict things such as churn behavior (the net number of new customers minus those leaving). By understanding attitudes and behavioral intent, marketers can intervene with actions such as timely offers and others intended to change behavior such as customers leaving.
Until recently, NPS and similar loyalty approaches have been one of the most adopted methods to track attitudes and 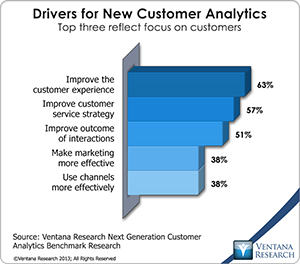 behaviors in customer interactions and to provide a logical way to impact and improve the customer experience. The prominence of such loyalty programs and metrics reflects an increasing focus on the customer. An indication of this increased focus is found in our next-generation customer analytics benchmark research, in which improving the customer experience (63%), improving customer service strategy (57%) and improving outcomes of interactions (51%) are the top drivers for adopting customer analytics. Nevertheless, while satisfaction and loyalty metrics such as NPS are entrenched in many organizations, there are three fundamental problems with them that can be overcome using big data analytics. Let’s look at each of these challenges and how big data analytics can overcome them.
It is prone to error. Current methods and metrics are vulnerable to errors, most deriving from one of three sources.
Coverage error results from measuring only a segment of a population and projecting the results onto the entire population. The problem here is clear if we imagine using data about California to draw conclusions about the entire United States. While researchers try to overcome such coverage error with stratified sampling methods, it necessitates significant investment usually not associated with business research. Additionally, nonresponse error, a subset of coverage error, results from people opting out of being measured.
Sample error is the statistical error associated with making conclusions about a population based on only a subset of a population. Researchers can overcome it by increasing sample sizes, but this, too, requires significant investment usually not associated with business research.
Measurement error is a complex topic that deserves an extended discussion beyond the scope here, but it presumes that analysts should start with a hypothesis and try to disprove it rather than to prove it. From there, iteration is needed to come as close to the truth as possible. In the case of NPS, measurement error can simply be the result of people not telling the truth or being unduly influenced by a recent experience that skews evaluations such as brand impression or likelihood to promote a brand. Another instance occurs when a proper response option is not represented and people are forced to give an incorrect response.
Big data can address these error vulnerability because it uses a census approach to data collection. Today companies can capture data about nearly every customer interaction with the brand, including customer service calls, website experiences, social media posts and transactions. Because the data is collected across the entire population and includes more revealed behavior than attitudinal and stated behavior, the error problems associated with NPS can be largely overcome.
It lacks causal linkage with financial metrics. The common claim that a higher NPS leads to increased revenue, like the presumed relationship between customer satisfaction and business outcomes, is impossible to prove in all circumstances and all industries. For instance, a pharmaceutical company trying to tie NPS to revenue might ask a doctor how likely he is to write a prescription for a certain drug. The doctor might see this as a compromising question and not be willing to answer honestly. Regarding satisfaction metrics, Microsoft in the 1990s had very low user satisfaction but high loyalty because it had a virtual monopoly. The airline industry today sees similar dynamics.
Big data analytics can show causal linkage between measurement of the customer experience and the organization’s financial metrics. It can link systems of record such as enterprise resource planning and enterprise performance management with systems of engagement such as content management, social media, marketing and sales. Collecting large data sets of customer interactions over time enable systems to relate customer experiences with purchase behaviors such as recency, frequency and size of purchase. This can be done on an ongoing basis and can be tested with randomized experiments. With big data platforms that can reduce data to the lowest common denominators in the form of key-value pairs, the only obstacles are to have the right skill sets, big data analytic software and enough data to be able to isolate variables and repeat the experiments over time. When there is enough data to do so, causal patterns emerge that can link customer attitudes and experiences directly with transactional outcomes. As long as there is enough data, such linkage can be revealed in any type of market such as wallet share in consumer packaged goods or “winner take all” markets such as automobiles.
It lacks actionable data. Often loyalty metrics such as NPS are tied to employee compensation. Those employees have a motivation to understand the metric and what action is needed to improve the score, but that is not easy due to a number of factors. Unlike quantitative metrics such as revenue or profitability, NPS and similar loyalty metrics are softer metrics whose impacts are not easily understood. Furthermore, the measurement may happen just once or twice a year, and the composition of the sample can change over time. Often what happens is a customer satisfaction team and consultants responsible for the research and analysis prepare the trend and driver analysis and share that with various teams with suggested areas of improvement and action to be taken. Such information is disseminated based on aggregated data broken out by important product and service segments and perhaps customer journey timelines. The problem is that even if employees understand the metric and how to impact it, by the time action is taken within the organization, it is not timely and not customized in an individual manner.
Big data analytics inherently has a streamlined capability to act upon data. Instead of the traditional process of reporting results and waiting months for action to be taken on those results and new results to show up in an NPS program, data can be acted upon immediately by all employees. A big reason for this is that data is now collected at a granular level for individual customers. For instance, if a customer with a high customer lifetime value (CLV) score shows signs that are precursors of switching companies, a report can be issued to show all interactions in that individual’s customer journey and highlight the most impactful events. Then an alert can be sent and a personal interaction such as a phone call or a face-to-face meeting can be set up with the objective of preventing the customer’s defection. Incentives such as a bank automatically waiving certain fees, an airline giving an upgrade to first-class or a grocery store giving a gift certificate can be recommended by the system as a next best action. It can also be done on a more automated but still personalized basis where the individual customer can be discreetly addressed to see how he or she can be made happy. Each of the actions can be measured against the value of the customer and contextualized for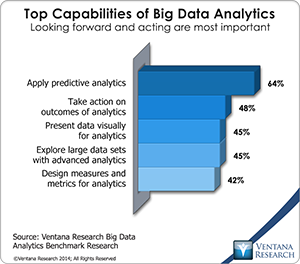 that customer. In this way, big data analytics platforms can bring together what used to be separate analytic models and action plans related to loyalty, churn, micromarketing campaigns and next best action. It is not surprising in this context that applying predictive analytics is the most important capability for big data analytics for nearly two-thirds (64%) of organizations participating in our research.I wrote about these ideas a few years ago, but only recently have I seen information systems capable of disrupting this entire category. It will not happen overnight since many NPS and satisfaction programs are tied to a component of employee compensation and internal processes that are not easily changed. Furthermore, NPS can still have value as a metric to understand word of mouth around a brand and in areas that lack data and better metrics. However, as attitudinal and behavioral big data continue to be collected and big data analytics technology continues to mature, revealed behavior will always outperform attitudinal and stated behavior data. Organizations that can challenge their conventional NPS wisdom and overcome internal political obstacles are likely to see superior return from their customer experience management investments.
Authors:
Ventana Research
Ventana Research, now part of Information Services Group (ISG), is the most authoritative and respected market research and advisory services firm focused on improving business outcomes through optimal use of people, processes, information and technology. Since our beginning, our goal has been to provide insight and expert guidance on mainstream and disruptive technologies. In short, we want to help you become smarter and find the most relevant technology to accelerate your organization's goals.