In 2014, IBM announced Watson Analytics, which uses machine learning and natural language processing to unify and simplify the user experience in each step of the analytic processing: data acquisition, data preparation, analysis, dashboarding and storytelling. After a relatively short beta testing period involving more than 22,000 users, IBM released Watson Analytics for general availability in December. There are two editions: the “freemium” trial version allows 500MB of data storage and access to file sizes less than 100,000 rows of data and 50 columns; the personal edition is a monthly subscription that enables larger files and more storage.
Its initial release includes functions to explore, predict and assemble data. Many of the features are based on IBM’s SPSS Analytic Catalyst, which I wrote about and which won the 2013 Ventana Research Technology Innovation Award for business analytics. Once data is uploaded, the explore function enables users to analyze data in an iterative fashion using natural language processing and simple point-and-click actions. Algorithms decide the best fit for graphics based on the data, but users may choose other graphics as needed. An “insight bar” shows other relevant data that may contain insights such as potential market opportunities.
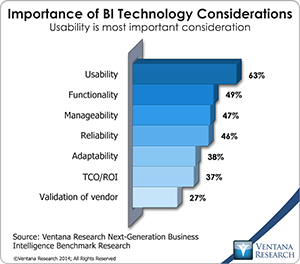
The ability to explore data through visualizations with minimal knowledge is a primary aim of modern analytics tools. With the explore function incorporating natural language processing, which other tools in the market lack, IBM makes analytics accessible to users without the need to drag and drop dimensions and measures across the screen. This feature should not be underestimated; usability is the buying criterion for analytics tools most widely cited in our benchmark research on next-generation business intelligence (by 63% of organizations).
 The predict capability of Watson Analytics focuses on driver analysis, which is useful in a variety of circumstances such as sales win and loss, market lift analysis, operations and churn analysis. In its simplest form, a driver analysis aims to understand causes and effects among multiple variables. This is a complex process that most organizations leave to their resident statistician or outsource to a professional analyst. By examining the underlying data characteristics, the predict function can address data sets, including what may be considered big data, with an appropriate algorithm. The benefit for nontechnical users is that Watson Analytics makes the decision on selecting the algorithm and presents results in a relatively nontechnical manner such as spiral diagrams or tree diagrams. Having absorbed the top-level information, users can drill down into top key drivers. This ability enables users to see relative attribute influences and interactivity between attributes. Understanding interactivity is an important part of driver analysis since causal variables often move together (a challenge known as multicollinearity) and it is sometimes hard to distinguish what is actually causing a particular outcome. For instance, analysis may blame the customer service department for a product defect and point to it as the primary driver of customer defection. Accepting this result, a company may mistakenly try to fix customer service when a product issue needs to be addressed. This approach also overcomes the challenge of Simpson’s paradox, in which a trend that appears in different groups of data disappears or reverses when these groups are combined. This is a hindrance for some visualization tools in the market.
Once users have analyzed the data sufficiently and want to create and share their analysis, the assemble function enables them to bring together various dashboard visualizations in a single screen. Currently, Watson Analytics does such sharing (as well as comments related to the visualizations) via email. In the future, it would good to see capabilities such as annotation and cloud-based sharing in the product.
Full data preparation capabilities are not yet integrated into Watson Analytics. Currently, it includes a data quality report that gives confidence levels for the current data based on its cleanliness, and basic sort, transform and relabeling are incorporated as well. I assume that IBM has much more in the works here. For instance, its DataWorks cloud service offers APIs for some of the best data preparation and master data management available today. DataWorks can mask data at the source and do probabilistic matching against many sources including both cloud and on-premises addresses. This is a major challenge organizations face when needing to conduct analytics across many data sets. For instance, in multichannel marketing, each individual customer may have many email addresses as well as different mailing addresses, phone numbers and identifiers for social media. A so-called “golden record” needs to be created so all such information can be linked together. Conceptually, the data becomes one long row of data related to that golden record, rather than multiple unassociated data in rows of shorter length. This data needs to be brought into a company’s own internal systems, and personally identifiable information must be stripped out before anything moves into a public domain. In a probabilistic matching system, data is matched not on one field but through associations of data which gives levels of certainty that records should be merged. This is different than past approaches and one of the reasons for significant innovation in the category. Multiple startups have been entering the data preparation space to address the need for a better user experience in data preparation. Such needs have been documented as one of the foundational issues facing the world of big data. Our benchmark research into information optimization shows that data preparation (47%) and quality and consistency (45%) are the most time-consuming tasks for organizations in analytics.
Watson Analytics is deployed on IBM’s SoftLayer cloud 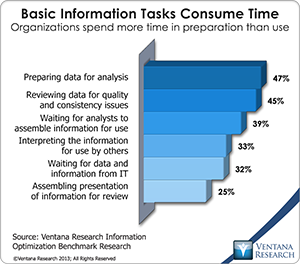 technology and is part of a push to move its analytic portfolio into the cloud. Early in 2015 the company plans to move its SPSS and Cognos products into the cloud via a managed service, thus offloading tasks such as setup, maintenance and disaster recovery management. Watson Analytics will be offered as a set of APIs much as the broader Watson cognitive computing platform has been. Last year, IBM said it would move almost all of its software portfolio to the cloud via its Bluemix service platform. These cloud efforts, coupled with the company’s substantial investment in partner programs with developers and universities around the world, suggest that Watson may power many next-generation cognitive computing applications, a market estimated to grow into the tens of billions of dollars in the next several years.
Overall, I expect Watson Analytics to gain more attention and adoption in 2015 and beyond. Its design philosophy and user experience are innovative, but work must be done in some areas to make it a tool that professionals use in their daily work. Given the resources IBM is putting into the product and the massive amounts of product feedback it is receiving, I expect initial release issues to be worked out quickly through the continuous release cycle. Once they are, Watson Analytics will raise the bar on self-service analytics.
Regards,
Tony Cosentino
VP and Research Director
Authors:
Ventana Research
Ventana Research, now part of Information Services Group (ISG), is the most authoritative and respected market research and advisory services firm focused on improving business outcomes through optimal use of people, processes, information and technology. Since our beginning, our goal has been to provide insight and expert guidance on mainstream and disruptive technologies. In short, we want to help you become smarter and find the most relevant technology to accelerate your organization's goals.