Tableau Software introduced its latest advancements in analytics and business intelligence software along with its future plan to more than 5,000 attendees at its annual user conference in its home town of Seattle. The enthusiasm of the primarily millennial-age crowd reflected not only the success of the young company but also its aspirations. The market for what Ventana Research calls visual and data discovery and Tableau have experienced rapid growth that is likely to continue.
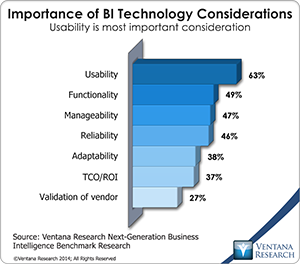 The company focuses on the mission of usability, which our benchmark research into next-generation business intelligence shows to be a top software buying criterion for more organizations (63%) than any other. Tableau introduced advances in this area including analytic ease of use, APIs, data preparation, storyboarding and mobile technology support as part of its user-centric product strategy. Without revealing specific timelines, executives said that the next major release, Tableau 9.0, likely will be available in the first half of 2015 as outlined by the CEO in his keynote.
Chief Development Officer and co-founder Chris Stolte showed upcoming ease-of-use features such as the addition of Excel-like functionality within workbooks. Users can type a formula directly into a field and use auto-completion or drag and drop to bring in other fields that are components of the calculation. The new calculation can be saved as a metric and easily added to the Tableau data model. Others announced included table calculations, geographic search capabilities and radial and lasso selection on maps. The live demonstration between users onstage was seamless and created flows that the audience could understand. The demonstration reflected impressive navigation capabilities.
Stolte also demonstrated upcoming statistical capabilities. Box plots have been available since Tableau 8.1, but now the capabilities have been extended for comparative analysis across groups and to create basic forecast models. The comparative descriptive analytics has been improved with drill-down features and calculations within tables. This is important since analysis between and within groups is necessary to use descriptive statistics to reveal business insights. Our research into big data analytics shows that the some of the most important analytic approaches are descriptive in nature: Pivot tables (48%), classification or decision trees (39%) and clustering (37%) are the methods most widely used for big data analytics.
When it comes to predictive analytics, however, Tableau is still somewhat limited. Companies such as IBM, Information Builders, MicroStrategy, SAS and SAP have focused more resources on incorporating advanced analytics in their discovery tools; Tableau has to catch up in this area. Forecasting of basic trend lines is a first step, but if the tool is meant for model builders, then I’d like to see more families of curves and algorithms to fit different data sets such as seasonal variations. Business users, Tableau’s core audience, need automated modeling approaches that can evaluate the characteristics of the data and produce adequate models. How different stakeholders communicate around the statistical parameters and models is also unclear to me. Our research shows that summary statistics and model comparisons are important capabilities for administering and sharing predictive analytics. Overall, Tableau is making strides in both descriptive and predictive statistics and making this intuitive for users.
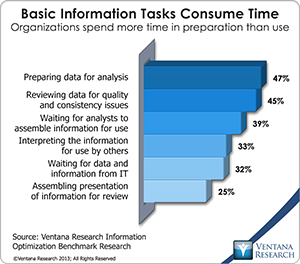 Presenters also introduced new data preparation capabilities on Excel imports including the abilities to view delimiters, split columns and even un-pivot data. The software also has some ability to clean up spreadsheets such as getting rid of headers and footers. Truly dirty data, such as survey data captured in spreadsheets or created with custom calculations and nesting, is not the target here. The data preparation capabilities can’t compare with those provided by companies such as Alteryx, Infromatica, Paxata, Pentaho, Tamr or Trifacta. However, it is useful to quickly upload and clean a basic Excel document and then visualize it in a single application. According to our benchmark research on information optimization, data preparation (47%) and checking data for quality and consistency (45%) are the primary tasks on which analysts spend their time.
Storytelling (which Tableau calls Storypoints), is an exciting area of development for the company. Introduced last year, it enables users to build a sequential narrative that includes graphics and text. New developments enable the user to view thumbnails of different visualizations and easily pull them into the story. Better control over calculations, fonts, colors and text positioning were also introduced. While these changes may seem minor, they are important to this kind of application. A major reason that most analysts take their data out of an analytic tool and put it into PowerPoint is to have this type of control and ease of use. While PowerPoint remains dominant when it comes to communicating analytic results in business, a new category of tools is challenging Microsoft’s preeminence in this area. Tableau Storypoints is one of the easiest to use in the market.
API advancements were discussed by Francois Ajenstat, senior director of product management, who suggested that in the future anything done on Tableau Server can be done through APIs. In this way different capabilities will be exposed so that other software can use them (Tableau visualizations, for example) within the context of their workflows. As well, Tableau has added REST APIs including JavaScript capabilities, which allow users to embed Tableau in applications to do such things as customize dashboards. The ability to visualize JSON data in Tableau is also a step forward since exploiting new data sources is the fastest way to gain business advantage from analytics. This capability was demonstrated using government data, which is commonly packaged in JSON format. As Tableau continues its API initiatives, we hope to see more advances in exposing APIs so Tableau can be integrated into governance workflows, which can be critical to enterprise implementations. APIs also can enable analytic workflow tools to more easily access the product so statistical modelers can understand the data prior to building models. While Tableau integrates on the back end with analytic tools such as Alteryx, the visual and data discovery aspects that must precede statistical model building are still a challenge. Having more open APIs will open up opportunities for Tableau’s customers and could broaden its partner ecosystem.
The company made other enterprise announcements such as Kerberos Security, easier content management, an ability to seamlessly integrate with Salesforce.com, and a parallelized approach to accessing very large data sets. These are all significant developments. As Tableau advances its enterprise vision and continues to expand on the edges of the organization, I expect it to compete in more enterprise deals. The challenge the company faces is still one of the enterprise data model. Short of displacing the enterprise data models that companies have invested in over the years, it will continue to be an uphill battle for Tableau to displace large incumbent BI vendors. Our research into Information Optimization shows that the integration with security and user-access frameworks is the biggest technical challenge for optimizing information. For a deeper look at Tableau’s battle for the enterprise, please read my previous analysis.
 Perhaps the most excitement from the audience came from the introduction of Project Elastic, a new mobile application with which users can automatically turn an email attachment in Excel into a visualization. The capability is native so it works in offline mode and provides a fast and responsive experience. The new direction bifurcates Tableau’s mobile strategy which heretofore was a purely HTML5 strategy introduced with Tableau 6.1. Tableau ranked seventh in our 2014 Mobile Business Intelligence Value Index.
Tableau has a keen vision of how it can carve out a place in the analytics market. Usability has a major role in building a following among users that should help it continue to grow. The Tableau cool factor won’t go unchallenged, however. Major players are introducing visual discovery products amid discussion about the need for more governance of data into the enterprise and cloud computing; Tableau likely have to blend into the fabric of analytics and BI in organizations. To do so, the company will need to forge significant partnerships and open its platform for easy access.
Organizations considering visual discovery software in the context of business and IT should include Tableau. For enterprise implementations, consideration should be done to ensure Tableau can support the broader manageability and reliability requirements for larger scale deployments. Visualization of data continues to be a critical method to understand the challenges of global business but should not be the only analytic approach taken for all types of users. Tableau is on the leading edge of visual discovery and should not be overlooked.
Regards,
Tony Cosentino
VP and Research Director
Authors:
Ventana Research
Ventana Research, now part of Information Services Group (ISG), is the most authoritative and respected market research and advisory services firm focused on improving business outcomes through optimal use of people, processes, information and technology. Since our beginning, our goal has been to provide insight and expert guidance on mainstream and disruptive technologies. In short, we want to help you become smarter and find the most relevant technology to accelerate your organization's goals.